Note: Data are from Fiscal Year 2021.
Number of DoD STEM Programs
< 25
26-50
51-75
76-100
> 100
DoD STEM programs have
0
connections with PreK-12 schools
0
connections with colleges and universities
DoD STEM programs offered a variety of activities.
60%
of DoD’s investment in STEM activities are resourced to postsecondary programs or programming.
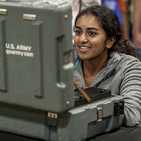

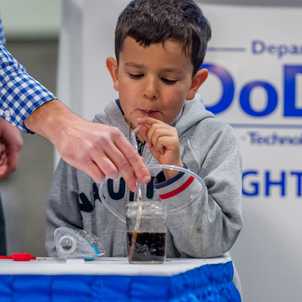
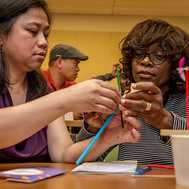
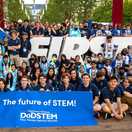



Note: Total may not sum to 100% because DoD STEM programs could choose more than one response.
Several DoD STEM programs operate using a consortium-based approach to engaging communities in STEM, and by creating STEM ecosystems.
Two examples are the Defense STEM Education Consortium (DSEC) and the Regional Community College Consortium. These programs focus on inspiring students of all ages, and opening doors to a wide range of STEM career pathways via activities such as hands-on laboratory exercises, courses, mentorship opportunities, internships, and more. These consortia include partnerships among DoD components, industry, academic institutions, and non-profit partners.
Interested in finding STEM
opportunities near you?
Interested in finding STEM
opportunities near you?
AttractSTEM workforce
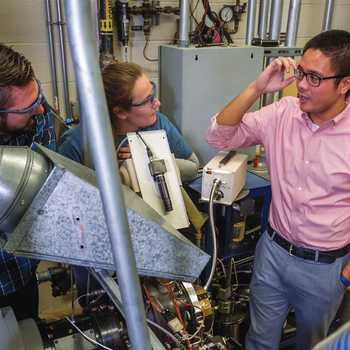
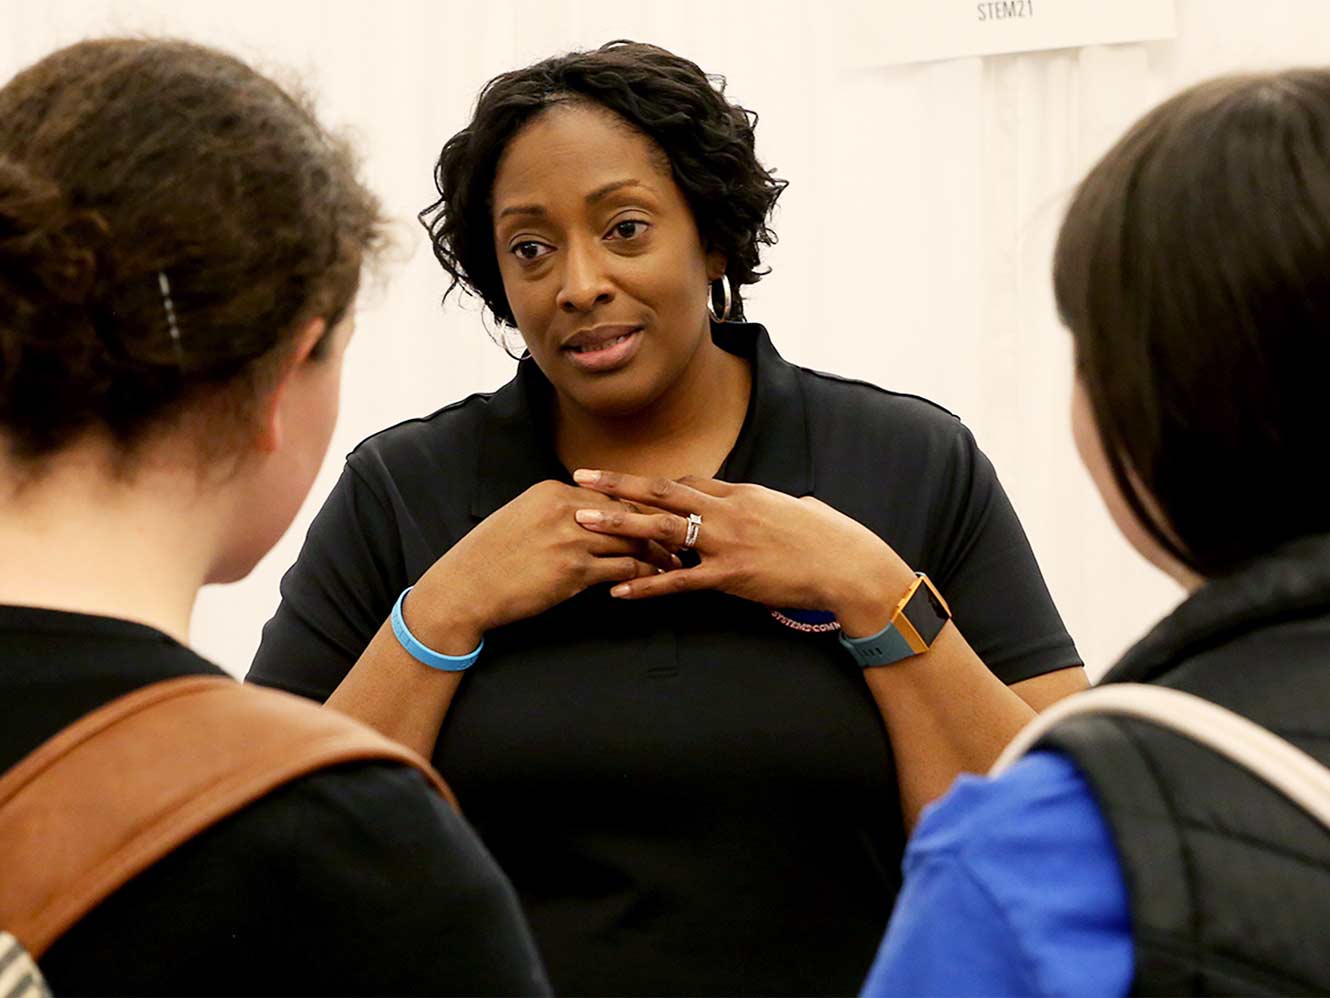
DoD STEM connects students to the DoD STEM workforce.
The DoD employs the largest number of scientists and engineers in the federal government. With the help of DoD STEM, these professionals are inspiring the next generation of STEM leaders. Each year, over 12,000 DoD scientists and engineers volunteer to help students of all ages build interest in STEM careers.
In 2021,
0
DoD scientists and engineers spent
0
hours volunteering with DoD STEM programs
You could travel around the sun 9 times in that many hours!
In 2021, DoD STEM programs served
10000
military-connected students.


66%
of programs reported direct alignment to Goal 3, objective 2: Expand the outreach of DoD STEM education and workforce development programs and activities to underserved and underrepresented communities through consideration of the barriers faced by these populations.
66%
of programs reported direct alignment to Goal 3, objective 2: Expand the outreach of DoD STEM education and workforce development programs and activities to underserved and underrepresented communities through consideration of the barriers faced by these populations.
Percentage of Students Engaged in DoD STEM Programs, by Race/Ethnicity
LATINO/A/X: 18%
Asian: 7%
Back or African American: 16%
Hispanic or Latino/A/X: 21%
Native American or Alaska Native: 2%
Native Hawaiian/Pacific Islander: <1%
White: 45%
More than one race/ethnicity: 5%
Not reported: 2%
Note: 61% of DoD STEM programs reported participant data by race/ethnicity. Total may not sum to 100% due to rounding.
Percentage of Students Engaged in DoD STEM Programs, by Gender
Male: 50%
Female: 49%
Self-identify: <1%
Not reported: <1%
Note: 76% of DoD STEM programs reported participant data by gender.
Partner Spotlight
Partner Spotlight
STEMKAMP
Grades 3-8
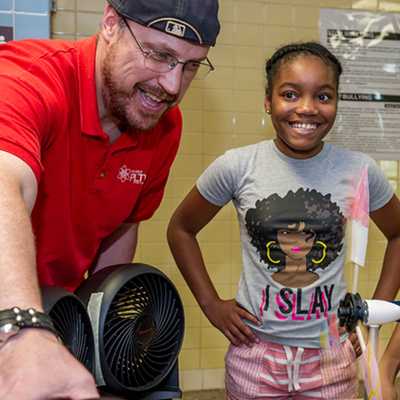
STEMKAMP partners with 10 military-connected school districts across the United States to bring hands-on summer science camps to students. Through these camps, students gain a better understanding of STEM careers, develop critical thinking engineering skills and gain the self-confidence and motivation to continue on paths toward STEM careers.
DoD STEM works with many STEM education and outreach partners to increase the participation of underserved and underrepresented students.
76%
of DoD STEM programs engaged in evaluation and assessment activities in 2021.
Although differences in program measures do not allow for cross-program comparisons, programs will be able to evaluate changes in student behaviors and attitudes over time as more data become available.
76%
of DoD STEM programs engaged in evaluation and assessment activities in 2021.
Although differences in program measures do not allow for cross-program comparisons, programs will be able to evaluate changes in student behaviors and attitudes over time as more data become available.
DoD STEM programming aligns to the overarching logic model.
Percentage of DoD STEM Programs Aligned With Logic Model Outcomes
DOD-RELEVANT STEM SKILLS
68%
QUALITY AND DIVERSE STEM WORKFORCE AND TALENT POOL
57%
TRADITIONAL AND NONTRADITIONAL PATHWAYS TO STEM
55%
CONTINUED EXCELLENCE IN DOD STEM WORKFORCE
46%
ENRICHED CLASSROOM TEACHING AND LEARNING
46%
DIVERSE STEM WORKFORCE
44%
COLLEGE-READY STEM STUDENTS:
39%
HIGH SCHOOL–READY STEM STUDENTS
31%
LEVERAGED STEM ECOSYSTEMS
26%
Note: Total may not sum to 100% because DoD STEM programs could choose more than one response.
Collectively, DoD STEM programming reaches a vast number of participants through a diverse offering of programs and opportunities, and continues to promote evaluation and reporting efforts across the Department.


The data on this page are from Fiscal Year 2021 (October 1, 2020 - September 30, 2021).
